|
|
|
|
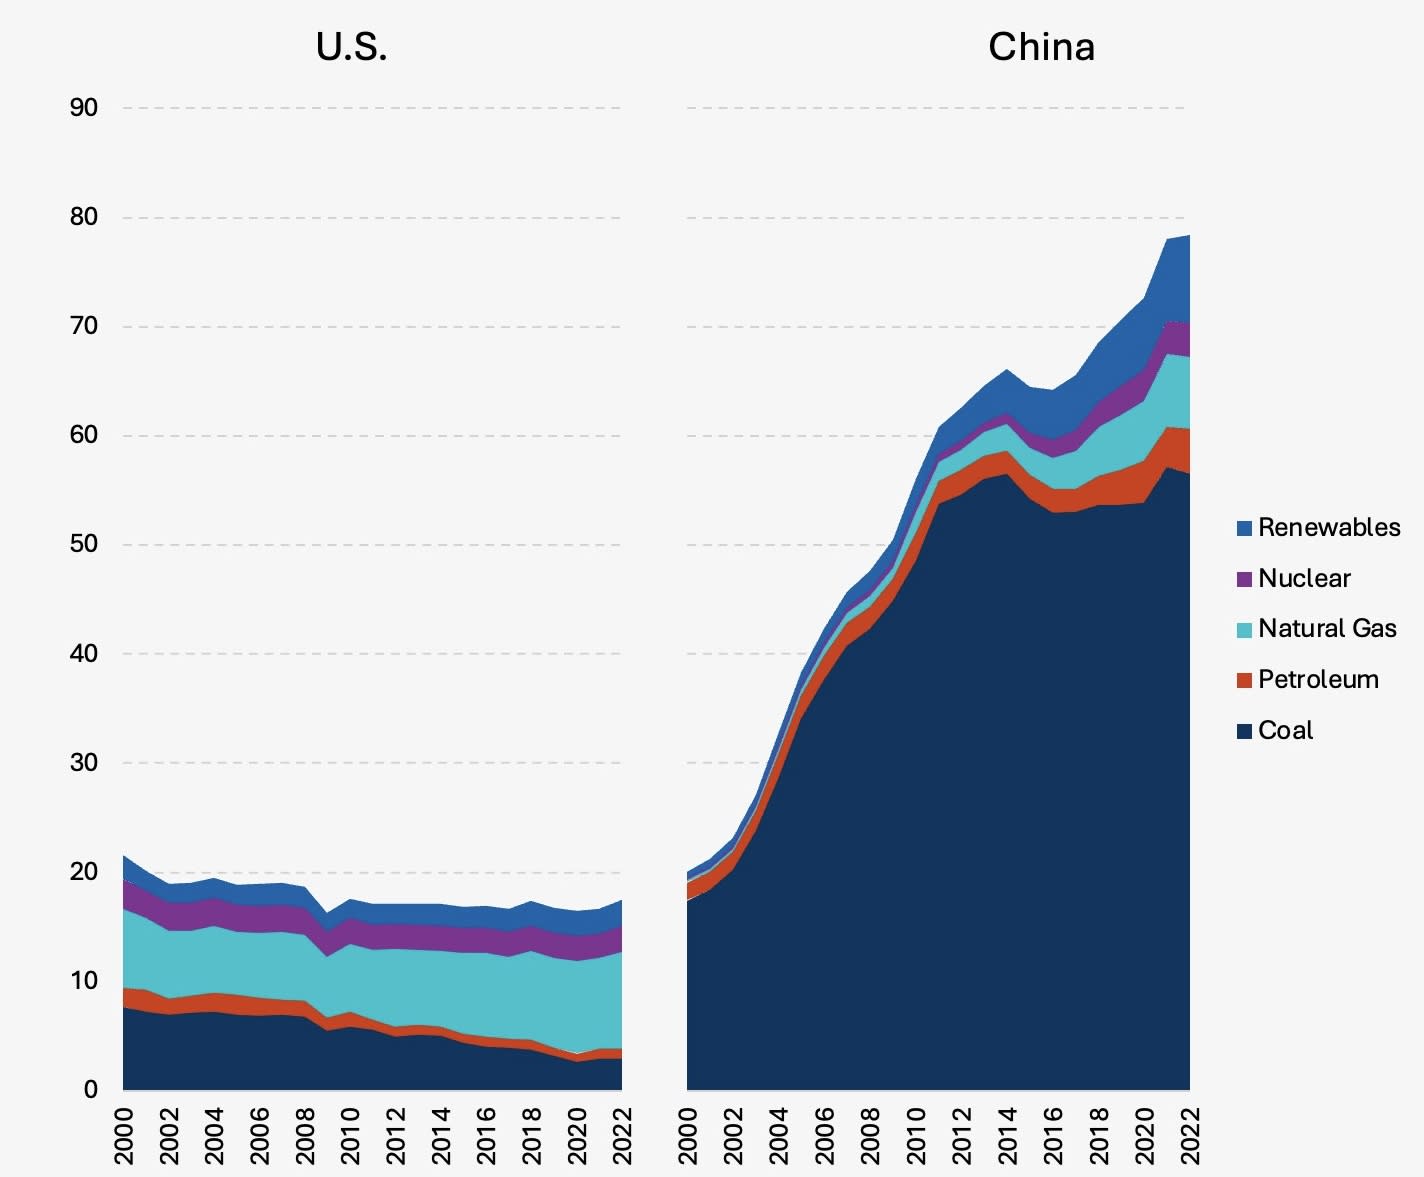
Hi, The Climate Leadership Council is obsessed with data. Here is one trend we’ve been thinking about lately: The U.S. is the second-largest global manufacturer after China. However, the energy inputs these two countries use to fuel industry are quite different. On average, for every dollar of industrial output in the U.S., we create one-third the greenhouse gasses (GHGs) as China. The Council’s carbon advantage research has increased awareness regarding the substantial differences in carbon efficiency across the global industrial sector. In this piece, we examine the trends in the primary energy inputs to the American and Chinese industrial sectors to help to understand the foundations of the U.S. industrial carbon advantage. The growth in the Chinese industrial sector over the past 25 years has been fueled by a colossal increase in fossil fuel consumption – especially coal. The chart shows the primary energy inputs to the U.S. and Chinese industrial sectors, including direct fuel use at facilities, and the implied share of primary energy inputs to power generation to meet industrial load.i Figure 1 – Primary energy inputs to industrial sector (quadrillion Btu)ii |
|
|
From 2000 to 2022, the Chinese industrial sector grew mostly through coal usage:
At the same time, the U.S. industrial sector continues to do more with less:
Comparing the charts, it is easy to see the U.S. carbon advantage should hold relatively steady for the foreseeable future. This state of affairs offers a tremendous opportunity to develop policies to enhance the competitiveness of the U.S. industrial sector, increase manufacturing employment and output, and lower global emissions. Stay tuned for more data insights from the Council, and let us know if this sparked any thoughts! We’re always happy to talk. |
|
|
|
i Based on IEA energy flow data, https://www.iea.org/data-and-statistics/data-product/world-energy-statistics-and-balances ii Renewables include geothermal, hydroelectric, solar, and wind |
|
|
|
Scott Nystrom Director, Policy and Research Climate Leadership Council 515-290-6990 |
|